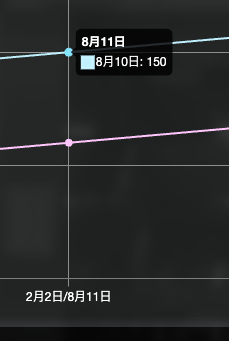
vue-chart-3でtooltipの作成(X軸ラベルを2つにしたい)
2023/09/12
Vue3のプロジェクト(バックエンドはLaravel)でグラフを表示するのにvue-chart-3を使用。
そこで、「1つのグラフ内に2つのdataset、それぞれにX軸ラベルをセットしたい」という要望があったので対応した内容を記載する。
Labels
const labels = ['2月1日/8月10日', '2月2日/8月11日', '2月3日/8月12日', '2月4日/8月13日', '2月5日/8月14日', '2月6日/8月15日', '2月7日/8月16日', ]labelsは複数のセットをサポートしていないようなので、単純に2つをスラッシュで繋いだ。
Tooltipでどちらのラベルなのかを表示
ラベルは単純に2つをつなげただけなので、Tooltip(マウスオーバーやクリック時に出てくるあれ)にどちらのラベルなのかを記載することに。
グラフ用のオプションは以下にした。
// グラフ設定
const thisChartOption = {
    responsive: true,
    maintainAspectRatio: false,
    scales: {
        x: {
            title: {
                display: false,
            },
            grid: {
                color: '#999',
            },
            ticks: {
                color: '#fff',
            }
        },
        y: {
            title: {
                display: false,
                text: '',
            },
            grid: {
                color: '#999',
            },
            ticks: {
                color: '#fff',
                stepSize: 50,
                callback: function(value: string) {
                    return parseFloat(value).toFixed(0);
                }
            },
            min: 50,
            max: 200,
        },
    },
    plugins: {
        legend: {
            display: true,
            labels: {
                color: '#fff',
            }
        },
        tooltip: {
            enabled: true,
            callbacks:{
                title: function(context: Context) {
                    // オリジナルのラベルを取得
                    console.log(context)
                    const originalLabel = context[0].label
                    const labels = originalLabel.split('/')
                    if(context[0].datasetIndex === 0) {
                        return labels[0]
                    }
                    else {
                        return labels[1]
                    }
                }
            }
        }
    },
}
【ポイント】
・tooltipをpluginsの中に。
・callbackの引数が3系では1つになっていることに注意。
今回は、コールバックの中では、ラベルを受け取って、スラッシュで区切り、どちらのラベルかを表示する、としている。

良い感じ。
コード全体はこちら
<template>
    <div class="scrollarea">
        <div class=" graph__garea ymslideanimation-enter-active">
            <LineChart
                :chart-data="chartData"
                :options="thisChartOption"
            />
        </div>
    </div>
</template>

<script setup lang="ts">
import { ref } from 'vue'

type Context = Array<{
    datasetIndex: number;
    label: string;
}>

const chartData = ref<Graph>({
    labels: [],
    datasets: [],
});

// グラフ設定
const thisChartOption = {
    responsive: true,
    maintainAspectRatio: false,
    scales: {
        x: {
            title: {
                display: false,
            },
        },
        y: {
            title: {
                display: false,
            },
        },
    },
    plugins: {
        legend: {
            display: true,
            labels: {
                color: '#fff',
            }
        },
        tooltip: {
            enabled: true,
            callbacks:{
                title: function(context: Context) {
                    // オリジナルのラベルを取得
                    console.log(context)
                    const originalLabel = context[0].label
                    const labels = originalLabel.split('/')
                    if(context[0].datasetIndex === 0) {
                        return labels[0]
                    }
                    else {
                        return labels[1]
                    }
                }
            }
        }
    },
}

// 実際はapiで取得
chartData.value.labels = ['2月1日/8月10日', '2月2日/8月11日', '2月3日/8月12日', '2月4日/8月13日', '2月5日/8月14日', '2月6日/8月15日', '2月7日/8月16日', ]
chartData.value.datasets = [
    {
    backgroundColor: "#FFCCFF",
    borderColor: "#FFCCFF",
    borderWidth: 2,
    label: "2月1日",
    data: [100, 110, 120, 130, 130, 130, 140, 140],
    },
    {
    backgroundColor: "#CCF2FF",
    borderColor: "#CCF2FF",
    borderWidth: 2,
    label: "8月10日",
    data: [140, 150, 160, 160, 160, 170, 170, 180],
    }
]

</script>